Who are our customers?
Group an online retailer's customers into stable, named segments with an action for each, and prove they predict next quarter better than simple rules. 22 steps, all shown in full: point-in-time features, choosing k by stability, validation on a held-back window, an API, batch scoring and drift monitoring.
Frame the problem: segments marketing can act on
Clustering projects fail quietly: the code runs, the plots look nice, and nobody can say whether the clusters mean anything. So the first job is to decide what a useful segmentation is, and how you will know you have one, before running k-means.
| Question | Answer |
|---|---|
| User | The marketing team of an online gift wholesaler |
| Decision | Which plan each group of customers gets: protect, grow, onboard, win back |
| Output | 4–7 named segments, an action per segment, and a segment for any customer on request |
| Success | Stable segments, none tiny, that separate next quarter's behaviour at least as well as simple RFM rules |
| Not for | Individual pricing, credit, or giving any group worse service |
docs/problem_framing.md (excerpt)15 lines
## Framing as ML
Unsupervised clustering of customers on behaviour features computed from transactions **before a cut-off date**.
There is no label to optimise, so we judge the result three ways:
1. internal quality: silhouette, Davies–Bouldin (how compact and separate the clusters are);
2. **stability**: the same clusters must reappear when we re-cluster resampled data (adjusted Rand index);
3. **external validity**: in the 3 months after the cut-off (never used to build segments), how much of the variation in
   spend the segments explain (eta²) and how well they rank who buys again (AUC), compared with RFM, with bootstrap CIs.

## Success criteria (set before modelling)
| criterion | threshold |
|---|---|
| stability (mean ARI over 20 resamples) | ≥ 0.75 |
| smallest segment | ≥ 2.5% of customers |
| eta² on next-quarter spend vs RFM | CI for the difference not below zero |
| names and actions | reviewed and accepted by marketing |configs/config.yaml41 lines
# All settings for the customer-segmentation project. Change values here, never in code.
project:
  name: segments
  seed: 42

paths:
  raw_csv: data/raw/online_retail.csv
  interim: data/interim/transactions_clean.parquet
  features: data/processed/customer_features.parquet
  outcomes: data/processed/customer_outcomes.parquet
  model_dir: models
  reports: reports
  runs: runs

data:
  source_url: https://archive.ics.uci.edu/static/public/352/online+retail.zip
  expected_rows_min: 500000         # the real file has 541,909 rows
  # Stock codes that are fees, postage or manual adjustments, not products.
  non_product_codes: [POST, DOT, D, M, C2, CRUK, PADS, S, B, BANK CHARGES, AMAZONFEE, ADJUST, ADJUST2, TEST001, TEST002]

window:
  # Features describe behaviour up to the cut-off; the following months are kept back as the "outcome window"
  # used only to check whether segments predict real future behaviour (never used to build them).
  cutoff: "2011-09-01"
  outcome_months: 3
  min_customer_days: 0              # include customers whose first purchase is before the cut-off

segmentation:
  k_min: 2
  k_max: 10
  stability_bootstraps: 20          # resample-and-recluster runs per k
  min_stability_ari: 0.75           # clusters must reproduce on resampled data
  min_segment_share: 0.025          # every segment must hold at least 2.5% of customers (ADR 0002)
  winsor_quantile: 0.995            # cap extreme wholesale customers before scaling

evaluation:
  bootstrap_samples: 1000

monitoring:
  psi_warn: 0.10
  psi_alert: 0.25
Reuse the professional repository layout
Same structure and quality gates as Project 1: an installable package under src/, typed
config, pinned dependencies, ruff, mypy in strict mode, pytest, pre-commit, CI and Docker. The Makefile names each step of this project.
Makefile54 lines
# One command per pipeline step. Run `make help` to list them.
PY ?= python
CONFIG ?= configs/config.yaml

.PHONY: help install data synthetic validate prepare eda segment evaluate all serve test lint typecheck check clean docker

help:          ## List the available commands
	@grep -E '^[a-z-]+:.*## ' Makefile | sed 's/:.*## /\t/'

install:       ## Install pinned dependencies and the package in editable mode
	$(PY) -m pip install -r requirements-dev.txt && $(PY) -m pip install -e . --no-deps && pre-commit install

data:          ## Download the real dataset from the UCI repository and convert it to CSV
	$(PY) -m segments.cli download --config $(CONFIG)

synthetic:     ## Create a synthetic transactions file with the same schema (no download needed)
	$(PY) scripts/make_synthetic.py --customers 6000 --out data/raw/online_retail.csv

validate:      ## Check the raw transactions against the schema
	$(PY) -m segments.cli validate --config $(CONFIG)

prepare:       ## Clean transactions, build customer features (before the cut-off) and outcomes (after it)
	$(PY) -m segments.cli prepare --config $(CONFIG)

eda:           ## Exploratory analysis of the feature window
	$(PY) -m segments.cli eda --config $(CONFIG)

segment:       ## Choose k, fit the segmentation, check stability, name the segments
	$(PY) -m segments.cli segment --config $(CONFIG)

evaluate:      ## Do segments predict the outcome window? Compare with the rule-based RFM baseline; segment card
	$(PY) -m segments.cli evaluate --config $(CONFIG)

all: validate prepare eda segment evaluate   ## Run the whole pipeline

serve:         ## Run the segment-assignment API locally
	$(PY) -m flask --app "segments.serving.app:create_app()" run --debug --port 8000

test:          ## Run the test suite
	$(PY) -m pytest

lint:          ## Lint and check formatting
	ruff check . && ruff format --check .

typecheck:     ## Static type checks
	mypy

check: lint typecheck test   ## Everything CI runs

docker:        ## Build the serving image
	docker build -t segments-api .

clean:         ## Remove generated data, models and reports
	rm -rf data/interim/* data/processed/* models/* reports/* runs/*
Download with provenance and cite the source
The UCI Online Retail dataset: every invoice line of a UK online retailer from December 2010 to December 2011 (541,909 lines). It is licensed CC BY 4.0, which requires attribution, so the data card carries the citation. The download script records the URL, time, SHA-256 checksum and row count, then converts the Excel file to CSV once so later steps are fast.
src/segments/data/download.py36 lines
def download(cfg: Config, force: bool = False) -> Path:
    """Fetch the zip from UCI, read the .xlsx inside, and write ``raw_csv`` plus PROVENANCE.json."""
    target = cfg.paths.raw_csv
    if target.exists() and not force:
        log.info("raw data already present at %s (use --force to re-download)", target)
        return target
    log.info("downloading %s", cfg.data.source_url)
    try:
        with urllib.request.urlopen(cfg.data.source_url, timeout=120) as resp:  # noqa: S310 (fixed https URL from config)
            payload = resp.read()
    except OSError as e:
        raise DownloadError(
            f"download failed ({e}); fetch the file by hand from {cfg.data.source_url}"
        ) from e
    digest = hashlib.sha256(payload).hexdigest()
    with zipfile.ZipFile(io.BytesIO(payload)) as zf:
        names = [n for n in zf.namelist() if n.lower().endswith(".xlsx")]
        if not names:
            raise DownloadError("no .xlsx file inside the downloaded zip")
        with zf.open(names[0]) as fh:
            # Read ids as text so leading zeros and the 'C' cancellation prefix survive.
            df = pd.read_excel(fh, dtype={"InvoiceNo": str, "StockCode": str})
    target.parent.mkdir(parents=True, exist_ok=True)
    df.to_csv(target, index=False)
    provenance = {
        "source": cfg.data.source_url,
        "zip_sha256": digest,
        "workbook": names[0],
        "rows": len(df),
        "csv": target.name,
        "downloaded_at": datetime.now(UTC).isoformat(timespec="seconds"),
        "citation": "Chen, D. (2015). Online Retail [Dataset]. UCI Machine Learning Repository. https://doi.org/10.24432/C5BW33",
    }
    (target.parent / "PROVENANCE.json").write_text(json.dumps(provenance, indent=2), encoding="utf-8")
    log.info("saved %d rows to %s (zip sha256 %s…)", len(df), target, digest[:12])
    return target
docs/data_card.md: the data dictionary10 lines
| column | meaning | notes |
|---|---|---|
| InvoiceNo | 6-digit invoice number | prefix **C** = cancellation (negative quantity), **A** = accounting adjustment |
| StockCode | product code | also non-products: POST (postage), M (manual), D (discount), BANK CHARGES, AMAZONFEE… |
| Description | product name | ~1,450 missing |
| Quantity | units on the line | negative for returns |
| InvoiceDate | date and time | |
| UnitPrice | price per unit in £ | 0 for some lines (samples, errors); negative on "Adjust bad debt" |
| CustomerID | 5-digit customer id | **missing on ~25% of lines** (guest checkouts) |
| Country | customer country | ~91% United Kingdom |Validate the raw file
Hard errors stop the pipeline: missing columns, too few rows, missing required values, invoice numbers not in the 6-digit format (with an optional C for cancellations or A for adjustments), non-integer quantities and unparseable dates. This dataset's well-known quirks are counted, not hidden: about a quarter of lines have no customer id, there are thousands of cancellations, duplicated lines, zero prices and "Adjust bad debt" entries.
src/segments/data/schema.py48 lines
def validate_raw(df: pd.DataFrame, expected_rows_min: int = 1) -> ValidationReport:
    """Check columns, invoice format, types, dates and the known quirks."""
    rep = ValidationReport()
    missing = [c for c in RAW_COLUMNS if c not in df.columns]
    if missing:
        rep.errors.append(f"missing columns: {missing}")
        return rep
    n = len(df)
    rep.facts["rows"] = n
    if n < expected_rows_min:
        rep.errors.append(f"only {n} rows; expected at least {expected_rows_min}")
    for col in ("InvoiceNo", "StockCode", "Quantity", "InvoiceDate", "UnitPrice", "Country"):
        k = int(df[col].isna().sum())
        if k:
            rep.errors.append(f"{k} missing values in required column {col}")
    bad_inv = ~df["InvoiceNo"].astype("string").str.match(INVOICE_PATTERN, na=False)
    if bad_inv.any():
        rep.errors.append(f"{int(bad_inv.sum())} invoice numbers not like 123456, C123456 or A123456")
    if not pd.api.types.is_integer_dtype(df["Quantity"]):
        rep.errors.append("Quantity must be whole numbers")
    dates = pd.to_datetime(df["InvoiceDate"], errors="coerce")
    if dates.isna().any():
        rep.errors.append(f"{int(dates.isna().sum())} unparseable InvoiceDate values")
    cid = pd.to_numeric(df["CustomerID"], errors="coerce")
    if (cid.dropna() % 1 != 0).any():
        rep.errors.append("CustomerID values must be whole numbers")

    inv = df["InvoiceNo"].astype("string")
    quirks = {
        "missing_customer_id": int(df["CustomerID"].isna().sum()),
        "cancellation_lines": int(inv.str.startswith("C").sum()),
        "adjustment_lines": int(inv.str.startswith("A").sum()),
        "negative_quantity_lines": int((df["Quantity"] < 0).sum()),
        "non_positive_price_lines": int((df["UnitPrice"] <= 0).sum()),
        "exact_duplicate_lines": int(df.duplicated().sum()),
        "missing_description": int(df["Description"].isna().sum()),
    }
    rep.facts.update(quirks)
    for name, k in quirks.items():
        if k:
            rep.warnings.append(f"{name.replace('_', ' ')}: {k:,} ({k / n:.1%})")
    if not rep.errors:
        rep.facts["date_min"] = str(dates.min().date())
        rep.facts["date_max"] = str(dates.max().date())
        rep.facts["customers"] = int(cid.nunique())
        rep.facts["countries"] = int(df["Country"].nunique())
        rep.facts["invoices"] = int(inv.nunique())
return repClean with named, counted rules
Each rule has a name and a reason, and the number of lines it removes is logged in reports/cleaning_log.json. Returns are
kept and flagged: they are real behaviour, reduce net spend, and become the return_rate feature.
src/segments/data/clean.py: the rules13 lines
rules: list[tuple[str, pd.Series]] = [
    # double-recorded lines inflate spend
    ("exact_duplicate_line", df.duplicated(keep="first")),
    # anonymous lines cannot be attributed to anyone
    ("missing_customer_id", df["customer_id"].isna()),
    # accounting entries, not customer activity
    ("adjustment_invoice", df["invoice"].str.startswith("A")),
    # postage, fees, manual lines
    ("non_product_code", df["stock_code"].isin(non_product)),
    # free samples and data errors
    ("non_positive_price", df["unit_price"] <= 0),
    ("zero_quantity", df["quantity"] == 0),
]
tests/test_data.py: every removed row is accounted for9 lines
def test_cleaning_rules_and_log(raw_small: pd.DataFrame) -> None:
    lines, log = clean(raw_small, NON_PRODUCT)
    assert lines["customer_id"].notna().all()
    assert not lines["stock_code"].isin(NON_PRODUCT).any()
    assert (lines["unit_price"] > 0).all()
    assert not lines["invoice"].str.startswith("A").any()
    assert not lines.duplicated().any()
    # every removed row is accounted for by exactly one named rule
assert log.rows_in - sum(log.removed.values()) == log.rows_out == len(lines)Split time into a feature window and an outcome window
This is the most important design decision in the project. Customer features use only purchases before a cut-off date (1 September 2011). The following three months are the outcome window: never used to build segments, only to check whether customers in different segments really behave differently afterwards.
| Period | Used for |
|---|---|
| Dec 2010 – Aug 2011 | Customer features, EDA, choosing k, fitting k-means |
| Sep – Nov 2011 | Outcomes only: did they buy again, and how much did they spend? |
It also mirrors how segments are used: you segment customers today and act on them over the coming months.
Build point-in-time customer features
Six behaviour features, each easy to explain to marketing: recency (days since the last order), frequency (number of orders), net spend after returns, average order value, tenure (days since the first order) and return rate. Country is kept for reporting but not used to form segments, which would otherwise split customers by geography rather than behaviour.
src/segments/features/build.py27 lines
def customer_features(lines: pd.DataFrame, cutoff: pd.Timestamp) -> pd.DataFrame:
    """One row per customer with at least one purchase before ``cutoff``. Index: customer_id."""
    past = lines[lines["invoice_ts"] < cutoff]
    buys = past[~past["is_return"]]
    rets = past[past["is_return"]]
    g = buys.groupby("customer_id")
    f = pd.DataFrame(
        {
            "first_purchase": g["invoice_ts"].min(),
            "last_purchase": g["invoice_ts"].max(),
            "frequency": g["invoice"].nunique().astype("float64"),
            "gross": g["line_value"].sum(),
            "distinct_products": g["stock_code"].nunique().astype("float64"),
            "country": g["country"].agg(lambda s: s.mode().iloc[0]),
        }
    )
    returned = (-rets.groupby("customer_id")["line_value"].sum()).reindex(f.index, fill_value=0.0)
    f["recency_days"] = (cutoff - f["last_purchase"]).dt.total_seconds() / 86400
    f["tenure_days"] = (cutoff - f["first_purchase"]).dt.total_seconds() / 86400
    # Net spend can dip below zero when a customer returns goods bought before the data starts.
    f["monetary"] = (f["gross"] - returned).clip(lower=0.0)
    f["avg_order_value"] = f["gross"] / f["frequency"]
    f["return_rate"] = (returned / f["gross"]).clip(0.0, 1.0)
    f["orders_per_month"] = f["frequency"] / np.maximum(1.0, f["tenure_days"] / 30.44)
    f["is_uk"] = (f["country"] == "United Kingdom").astype("int8")
    f.index.name = "customer_id"
    return f[RAW_FEATURES + ["is_uk", "country"]].sort_index()
tests/test_features.py: a leakage test7 lines
def test_point_in_time_nothing_after_cutoff_leaks_into_features() -> None:
    base = [("a", "2011-08-01", 100.0, False)]
    future = [("a", "2011-10-01", 5000.0, False), ("b", "2011-10-05", 70.0, False)]
    f1 = customer_features(_lines(base), CUT)
    f2 = customer_features(_lines(base + future), CUT)
    pd.testing.assert_frame_equal(f1, f2)
assert "b" not in f2.indexExplore the feature window
Two findings drive the modelling choices:
- Extreme skew. A small share of wholesale customers account for a large share of spend. k-means minimises squared distances, so without care a few giants would get a cluster each and everyone else would be lumped together.
- Strong seasonality. Revenue climbs towards Christmas, so recency depends on the cut-off date. That is why the cut-off is fixed in the config and every run uses the same one.
make eda writes reports/eda.md with revenue by month, feature distributions, Spearman correlations and country
shares, each followed by the decision it leads to.
Cap, log and scale inside one pipeline
Each feature is capped at its 99.5th percentile (learned from the data the pipeline is fitted on), the skewed ones are log-transformed,
and all are standardised so each feature counts equally in the distance. Everything sits inside one scikit-learn Pipeline, so
the API and batch scoring apply exactly the same transformations.
src/segments/models/segment.py: a custom transformer19 lines
class Winsorizer(BaseEstimator, TransformerMixin):  # type: ignore[misc]
    """Cap each column at a high quantile learned during ``fit`` (stops a few giant accounts dominating)."""

    def __init__(self, quantile: float = 0.995) -> None:
        self.quantile = quantile

    def fit(self, X: pd.DataFrame, y: object = None) -> Winsorizer:
        """Learn the per-column caps from the training data."""
        self.caps_ = X.quantile(self.quantile)
        self.feature_names_in_ = np.asarray(X.columns, dtype=object)
        return self

    def transform(self, X: pd.DataFrame) -> pd.DataFrame:
        """Clip each column at its learned cap."""
        return X.clip(upper=self.caps_, axis=1)

    def get_feature_names_out(self, input_features: object = None) -> npt.NDArray[np.object_]:
        """Return the input column names (the transform keeps them)."""
        return self.feature_names_in_
src/segments/models/segment.py: the pipeline10 lines
def build(k: int, seed: int, winsor_quantile: float) -> Pipeline:
    """Unfitted segmentation pipeline for ``k`` segments."""
    return Pipeline(
        [
            ("cap", Winsorizer(winsor_quantile)),
            ("log", FunctionTransformer(_log_skewed, feature_names_out="one-to-one")),
            ("scale", StandardScaler()),
            ("kmeans", KMeans(n_clusters=k, n_init=20, random_state=seed)),
        ]
).set_output(transform="pandas")Set the baseline: classic RFM rules
Retailers have segmented customers with RFM (recency, frequency, monetary) quintile scores for decades. They need no ML, are easy to explain and are the bar k-means must clear. If it cannot, the honest recommendation is to use the rules.
src/segments/models/segment.py17 lines
def rfm_baseline(X: pd.DataFrame) -> pd.Series:
    """Classic rule-based RFM segments (quintile scores), the baseline any ML segmentation must beat."""
    r = pd.qcut(X["recency_days"].rank(method="first"), 5, labels=[5, 4, 3, 2, 1]).astype(int)
    f = pd.qcut(X["frequency"].rank(method="first"), 5, labels=[1, 2, 3, 4, 5]).astype(int)
    m = pd.qcut(X["monetary"].rank(method="first"), 5, labels=[1, 2, 3, 4, 5]).astype(int)
    seg = np.select(
        [
            (r >= 4) & (f >= 4) & (m >= 4),
            (f >= 4),
            (r <= 2) & (f >= 3),
            (r >= 4) & (f <= 2),
            (r <= 2) & (f <= 2),
        ],
        ["Champions", "Loyal", "At risk", "Promising", "Hibernating"],
        default="Need attention",
    )
return pd.Series(seg, index=X.index, name="rfm_segment")Measure stability
A cluster that disappears when you resample the data is not a real group. For each k, the pipeline is refitted on 20 random 80% samples and compared with the full-data clustering on the shared customers using the adjusted Rand index (ARI: 1 = identical, 0 = chance).
src/segments/models/segment.py10 lines
def stability(X: pd.DataFrame, k: int, seed: int, q: float, runs: int, frac: float = 0.8) -> float:
    """Mean adjusted Rand index between the full-data clustering and clusterings of random subsamples."""
    ref = build(k, seed, q).fit(X).predict(X)
    rng = np.random.default_rng(seed)
    scores = []
    for b in range(runs):
        idx = rng.choice(len(X), int(frac * len(X)), replace=False)
        sub = build(k, seed + b + 1, q).fit(X.iloc[idx])
        scores.append(adjusted_rand_score(ref, sub.predict(X)))
return float(np.mean(scores))tests/test_segment.py10 lines
def test_well_separated_groups_are_stable() -> None:
    rng = np.random.default_rng(0)
    rows = []
    for rec, freq, mon in [(5, 20, 5000), (200, 1, 80)]:
        for _ in range(150):
            m = mon * rng.lognormal(0, 0.1)
            fr = max(1, round(freq * rng.lognormal(0, 0.1)))
            rows.append([rec * rng.lognormal(0, 0.1), fr, m, m / fr, 300.0, 0.0])
    X = pd.DataFrame(rows, columns=SEGMENT_FEATURES)
assert stability(X, 2, seed=0, q=0.995, runs=4) > 0.95Choose k with explicit rules
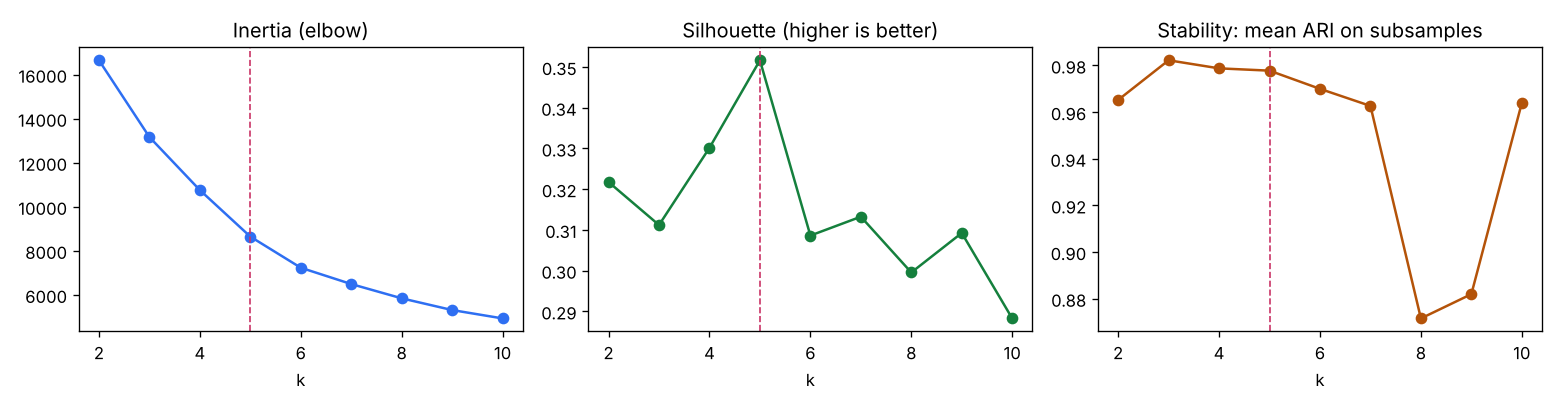
The elbow plot is notoriously ambiguous and silhouette alone often prefers k = 2, which is useless for marketing. So k is chosen by written rules: keep only k values whose clusters are stable (mean ARI ≥ 0.75) and whose smallest segment holds at least 2.5% of customers, then take the best silhouette. If nothing passes, the most stable k is chosen and the reason says it needs review.
src/segments/models/segment.py10 lines
def choose_k(results: list[dict[str, float]], min_ari: float, min_share: float) -> tuple[int, str]:
    """Apply the selection rule; returns (k, reason)."""
    ok = [r for r in results if r["stability_ari"] >= min_ari and r["min_share"] >= min_share]
    if not ok:
        best = max(results, key=lambda r: r["stability_ari"])
        return int(best["k"]), "no k met both rules; chose the most stable k (review before use)"
    best = max(ok, key=lambda r: (round(r["silhouette"], 3), -r["k"]))
    return int(
        best["k"]
), f"highest silhouette among {len(ok)} k values that are stable and have no tiny segments"Profile and name the segments
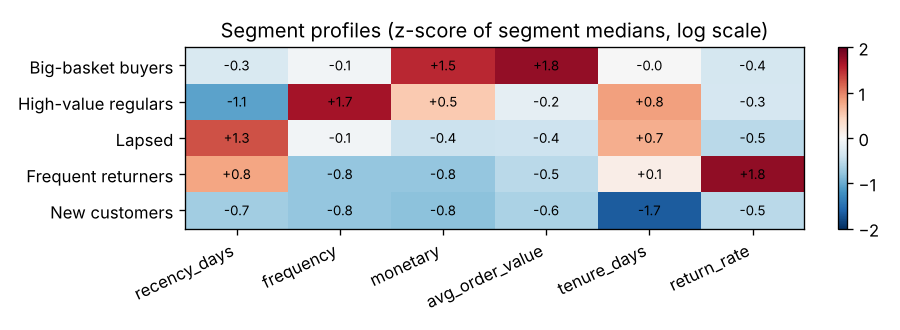
Each segment is described by the medians of its features, compared with the other segments on a z-scored log scale. Simple rules turn the profiles into names such as "High-value regulars" or "Lapsed". The names are a starting point: the segment card says they must be reviewed by the marketing team.
src/segments/models/segment.py32 lines
class SegmentNamer:
    """Turns segment profiles into human-readable names (to be reviewed by the marketing team)."""

    def name(self, profile: pd.DataFrame) -> dict[int, str]:
        """``profile``: one row per segment with median raw features; returns {segment: name}."""
        z = (np.log1p(profile[LOG_FEATURES]) - np.log1p(profile[LOG_FEATURES]).mean()) / (
            np.log1p(profile[LOG_FEATURES]).std() + 1e-9
        )
        names: dict[int, str] = {}
        for seg, r in z.iterrows():
            if float(profile.loc[seg, "return_rate"]) >= RETURNER_RATE:
                label = "Frequent returners"
            elif r["recency_days"] > 0.8:
                label = "Lapsed"
            elif r["frequency"] > 0.8 and r["monetary"] > 0.5:
                label = "High-value regulars"
            elif r["avg_order_value"] > 0.8 and r["frequency"] <= 0.5:
                label = "Big-basket buyers"
            elif r["tenure_days"] < -0.8:
                label = "New customers"
            elif r["frequency"] > 0.2:
                label = "Steady regulars"
            else:
                label = "Occasional buyers"
            names[int(str(seg))] = label
        seen: dict[str, int] = {}
        for seg in sorted(names, key=lambda s: -float(profile.loc[s, "monetary"])):
            base = names[seg]
            seen[base] = seen.get(base, 0) + 1
            if seen[base] > 1:
                names[seg] = f"{base} ({seen[base]})"
return namesTest the segments on the next quarter
Now the outcome window is used, once. Two measures, for both k-means and RFM:
- eta²: the share of variation in next-quarter spend (log scale) explained by segment membership.
- Repeat-purchase AUC: rank customers by their segment's repeat rate and check how well that ranks who actually bought again. The rates are cross-fitted (computed on other customers' folds), so no customer's own outcome scores them.
The difference between the two methods is bootstrapped to give a 95% interval.
src/segments/evaluation/report.py8 lines
def crossfit_rate_auc(purchased: npt.ArrayLike, groups: npt.ArrayLike, seed: int = 0) -> float:
    """AUC of segment repeat-purchase rates computed on other folds (no self-scoring)."""
    y, g = np.asarray(purchased), np.asarray(groups)
    score = np.zeros(len(y))
    for fit, hold in KFold(5, shuffle=True, random_state=seed).split(y):
        rates = pd.Series(y[fit]).groupby(g[fit]).mean()
        score[hold] = pd.Series(g[hold]).map(rates).fillna(y[fit].mean()).to_numpy()
    return float(roc_auc_score(y, score))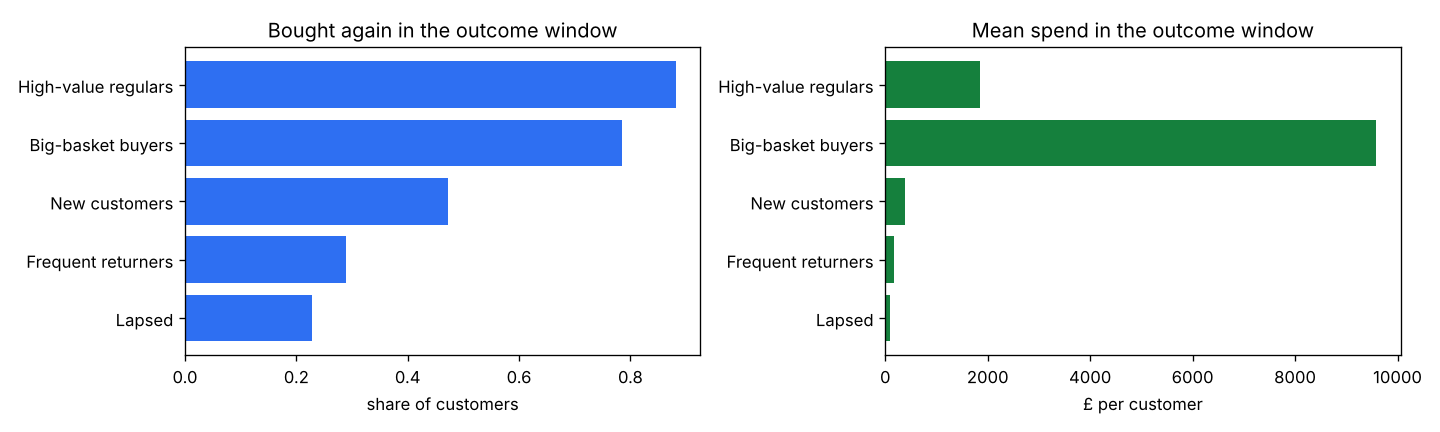
Report the result honestly
On the synthetic data, k-means explained more of next-quarter spend than RFM (interval for the difference above zero) but ranked repeat buyers slightly worse (interval just below zero). That is a typical, realistic outcome, and the card says so in plain words: k-means wins for planning spend-based campaigns; RFM is as good for "who will come back". A project that always reports a clean win is less credible than one that shows a mixed result and explains it.
Write the segment card
The segmentation equivalent of a model card, generated by make evaluate: version, method, why this k, the segment table with
next-quarter behaviour, the comparison with RFM, suggested actions per segment, limitations, privacy and fairness, and the monitoring plan.
segment card template (excerpt)3 lines
## Intended use
Plan **marketing actions per segment** (retention, cross-sell, win-back) and track segment sizes over time.
**Not for:** individual pricing, credit or any decision that disadvantages a customer; segments describe past purchasing only.Test data, features, segments and API
40 tests: validation rules, the cleaning log adding up, hand-computed features, point-in-time guards, outcome-window boundaries, the k-selection rules, determinism, stability on known groups, the namer, metric arithmetic (eta², cross-fitted AUC, PSI), an end-to-end run, the drift alert, API contract tests and training-serving parity.
tests/test_pipeline_and_api.py: API and batch agree15 lines
def test_assign_matches_batch_scoring(client: FlaskClient, trained: Config) -> None:
    """The API and the batch pipeline must give the same answer for the same customer."""
    from segments.features.build import SEGMENT_FEATURES
    from segments.io import load_table

    ref = load_table(trained.paths.model_dir / "reference_assignments.parquet").head(20)
    body = {
        "customers": [
            {"customer_id": str(r.customer_id), **{f: float(getattr(r, f)) for f in SEGMENT_FEATURES}}
            | {"frequency": int(r.frequency)}
            for r in ref.itertuples()
        ]
    }
    got = [x["segment_id"] for x in client.post("/v1/assign", json=body).get_json()["assignments"]]
assert got == ref["segment"].astype(int).tolist()Serve segment assignment
POST /v1/assign takes up to 5,000 customers' summary features (computed by the data warehouse on the scoring date) and
returns the segment, the runner-up segment and the distance margin between them, so borderline customers can be handled with care.
Inputs are validated, including a consistency check (the last order cannot be before the first). Customer ids are never logged.
src/segments/serving/schemas.py18 lines
class Customer(BaseModel):
    """A customer's behaviour summary as of the scoring date (computed by the data warehouse)."""

    model_config = ConfigDict(extra="forbid")

    customer_id: str = Field(min_length=1, max_length=40)
    recency_days: float = Field(ge=0, le=3650)
    frequency: int = Field(ge=1, le=100000, description="number of purchase invoices")
    monetary: float = Field(ge=0, description="net spend after returns")
    avg_order_value: float = Field(gt=0)
    tenure_days: float = Field(ge=0, le=36500)
    return_rate: float = Field(ge=0, le=1)

    @model_validator(mode="after")
    def _consistent(self) -> Customer:
        if self.recency_days > self.tenure_days + 1e-9:
            raise ValueError("recency_days cannot exceed tenure_days (last order before first order)")
        return self
src/segments/serving/app.py: nearest and runner-up segment8 lines
def assign(bundle: dict[str, Any], X: pd.DataFrame) -> tuple[np.ndarray, np.ndarray, np.ndarray]:
    """Nearest and second-nearest segment for each row, and the distance margin between them."""
    pipe = bundle["pipeline"]
    # distances to every centroid (as a plain array: the pipeline is configured for pandas output)
    d = np.asarray(pipe[-1].transform(pipe[:-1].transform(X[SEGMENT_FEATURES])), dtype=float)
    order = np.argsort(d, axis=1)
    rows = np.arange(len(d))
return order[:, 0], order[:, 1], d[rows, order[:, 1]] - d[rows, order[:, 0]]Batch scoring, Docker and CI
Most segmentations run as a monthly batch: python -m segments.cli assign --transactions … --as-of … recomputes features at
the scoring date and writes customer_id, segment, margin. The Dockerfile and CI workflow follow Project 1.
.github/workflows/ci.yml28 lines
name: ci
on:
  push:
  pull_request:

jobs:
  check:
    runs-on: ubuntu-latest
    steps:
      - uses: actions/checkout@v4
      - uses: actions/setup-python@v5
        with:
          python-version: "3.12"
          cache: pip
      - name: Install
        run: |
          python -m pip install -r requirements-dev.txt
          python -m pip install -e . --no-deps
      - name: Lint
        run: ruff check . && ruff format --check .
      - name: Type check
        run: mypy
      - name: Tests (synthetic data, no download needed)
        run: python -m pytest --cov=segments --cov-report=term-missing
      - name: Pipeline smoke run on synthetic data
        run: |
          python scripts/make_synthetic.py --customers 800 --out data/raw/online_retail.csv
          make all CONFIG=configs/ci.yaml
Monitor drift in features and segment shares
Each month, compare the newly scored customers with the reference: PSI for each feature and for the segment shares. The
monitor command exits with code 2 on an alert, so a scheduler can notify someone. Expect alerts around Christmas; compare
like-for-like months before deciding to refit.
src/segments/monitoring/drift.py8 lines
def drift_report(ref: pd.DataFrame, cur: pd.DataFrame, warn: float, alert: float) -> pd.DataFrame:
    """PSI and status for each segmentation feature and for the segment shares, worst first."""
    rows = [{"item": f, "psi": psi_numeric(ref[f], cur[f])} for f in SEGMENT_FEATURES]
    rows.append({"item": "segment shares", "psi": psi_shares(ref["segment"], cur["segment"])})
    rep = pd.DataFrame(rows)
    rep["psi"] = rep["psi"].round(4)
    rep["status"] = np.where(rep["psi"] >= alert, "alert", np.where(rep["psi"] >= warn, "warn", "ok"))
return rep.sort_values("psi", ascending=False).reset_index(drop=True)docs/monitoring.md16 lines
# Monitoring plan

| what | how | when | action |
|---|---|---|---|
| feature drift | PSI of each feature vs the reference assignments | monthly re-score | warn ≥ 0.10, alert ≥ 0.25 |
| segment shares | PSI of segment shares vs reference | monthly | alert: review campaigns, consider refit |
| external validity | eta² and AUC on the latest closed quarter | quarterly | refit if below the RFM baseline |
| API | latency, 4xx/5xx rate, request volume (logs carry request id, no customer ids) | continuous | page on 5xx > 1% |

```bash
python -m segments.cli monitor --transactions data/raw/latest.csv --as-of 2012-01-01   # exit code 2 = alert
```
Expect seasonal alerts in November–December (the Christmas peak). Compare like-for-like months before refitting.

**Refit:** quarterly, or after an alert that persists two months. Re-run stability and outcome checks, match new centroids
to old ones (Hungarian matching on centroid distance) so names carry over, and get marketing sign-off on any new segment.
Plan refits that keep names stable
Refit quarterly or after a persistent alert. Re-run the stability and outcome checks, then match new centroids to old ones (the Hungarian algorithm on centroid distances) so "High-value regulars" still means the same group next quarter. Any new segment needs marketing sign-off before campaigns change.
Present it in your portfolio
- Lead with the segment table and the next-quarter chart: they show the segments mean something.
- Explain the k-selection rule and the honest comparison with RFM; interviewers often ask "how did you choose k?".
- Mention the feature and outcome windows: it shows you think about leakage even without a label.